







 SaisonPersonal project · 2026
Sports statistics that everyone can read
I designed a site that makes the advanced statistics of the five major leagues readable without being an analyst, and I had it built in nine days by directing an AI.
- The problem
- Football statistics sites pile up tables: xG, xA, progressive passes. You switch off by the second acronym.
- What I learned
- The hardest part was not adding numbers, but choosing which ones to show.
- My part
- I did not write the code: I wrote the brief, made every decision and checked every screen. Claude Code did the development.
- Deliverable
- full website, light and dark, NBA version, widget system, automatic weekly update
- Role
- product design, data design, leading development
- Context
- personal project, unofficial concept, public data: Understat, transfermarkt-datasets, Wikidata, Wikipedia, stats.nba.com
- Team
- solo, developed with Claude Code
Context
I wanted a fan to understand at a glance what a player's numbers are worth.
Numbers everywhere, little interpretation
- Take nothing directly from a statistics site: only public, open datasets
- Compare by position and per 90 minutes, otherwise a substitute looks like the top scorer
- No data shown without a reference point: a number on its own means nothing
- Readable by everyone, including for eyes that confuse red and green
- An unofficial concept, password-protected and not indexed, because it shows real logos
What had to be balanced
- DepthThousands of players and dozens of measures, for anyone who wants to dig deeper.
- ReadabilityA page you can understand without knowing the acronyms.
- AccuracyFair comparisons that always say who you are being compared with.
How do you make advanced statistics readable without simplifying them to the point of distorting them?
Exploration
Each idea was tried for real on the site, then kept or dropped once I could see it.
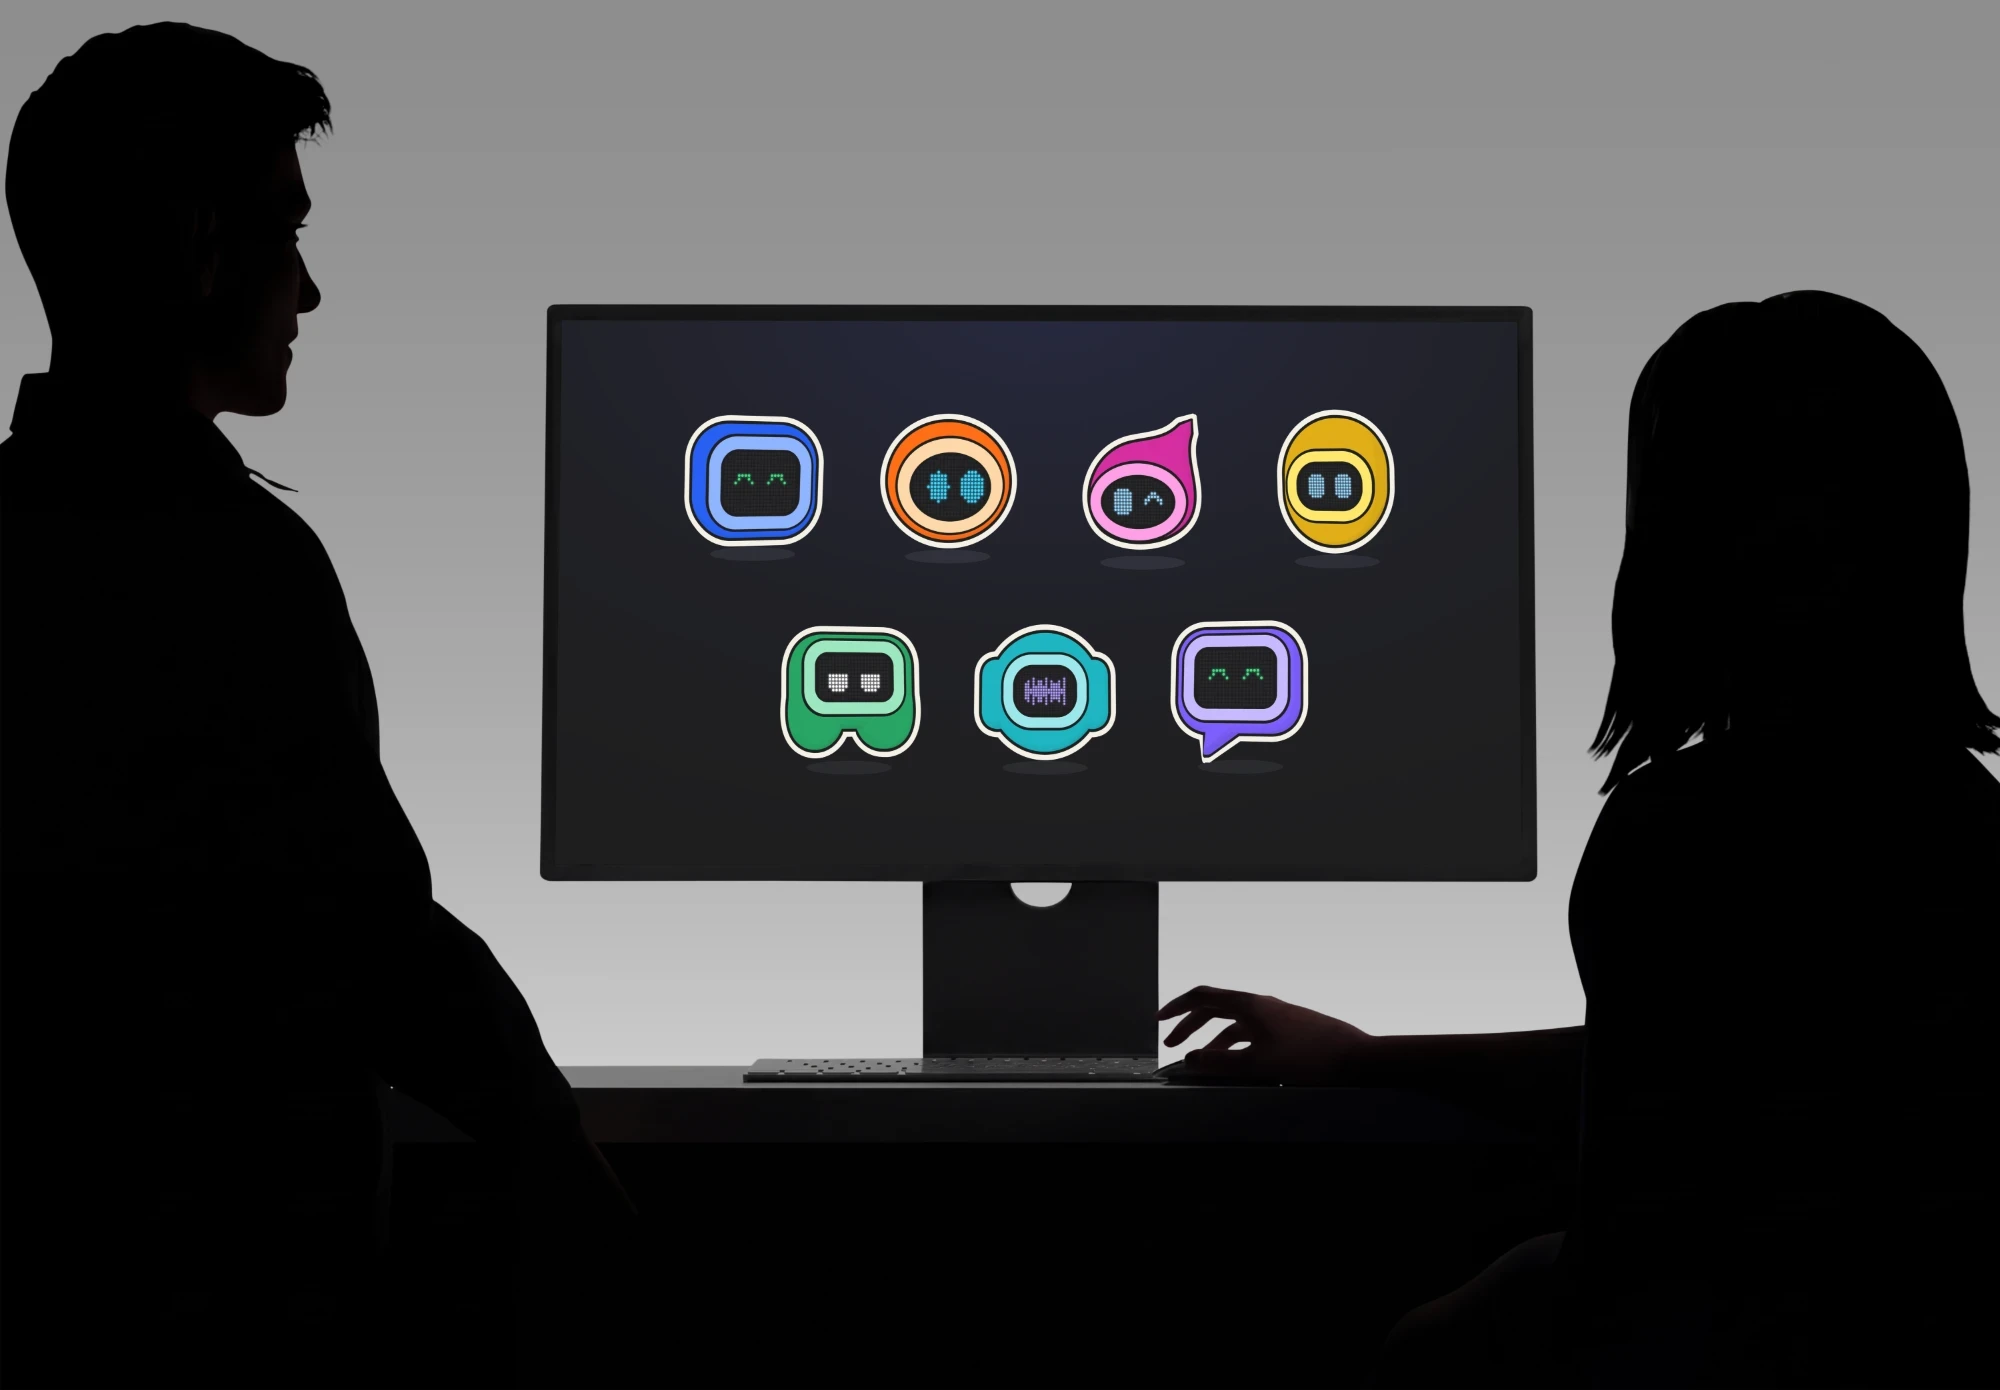
Four names, and many ideas dropped
At first I wanted to translate everything into sentences. The site became more accurate by removing things, not by adding them.
- A sentence for every number“He scores 4 goals more than expected”: replaced by short labels with the detail on hover, quicker to readDropped
- Player photos and avatarsRemoved: a player is shown by their name and their club's logoDropped
- A 3D pitch as the backgroundRemoved: it drew the eye away from the numbersDropped
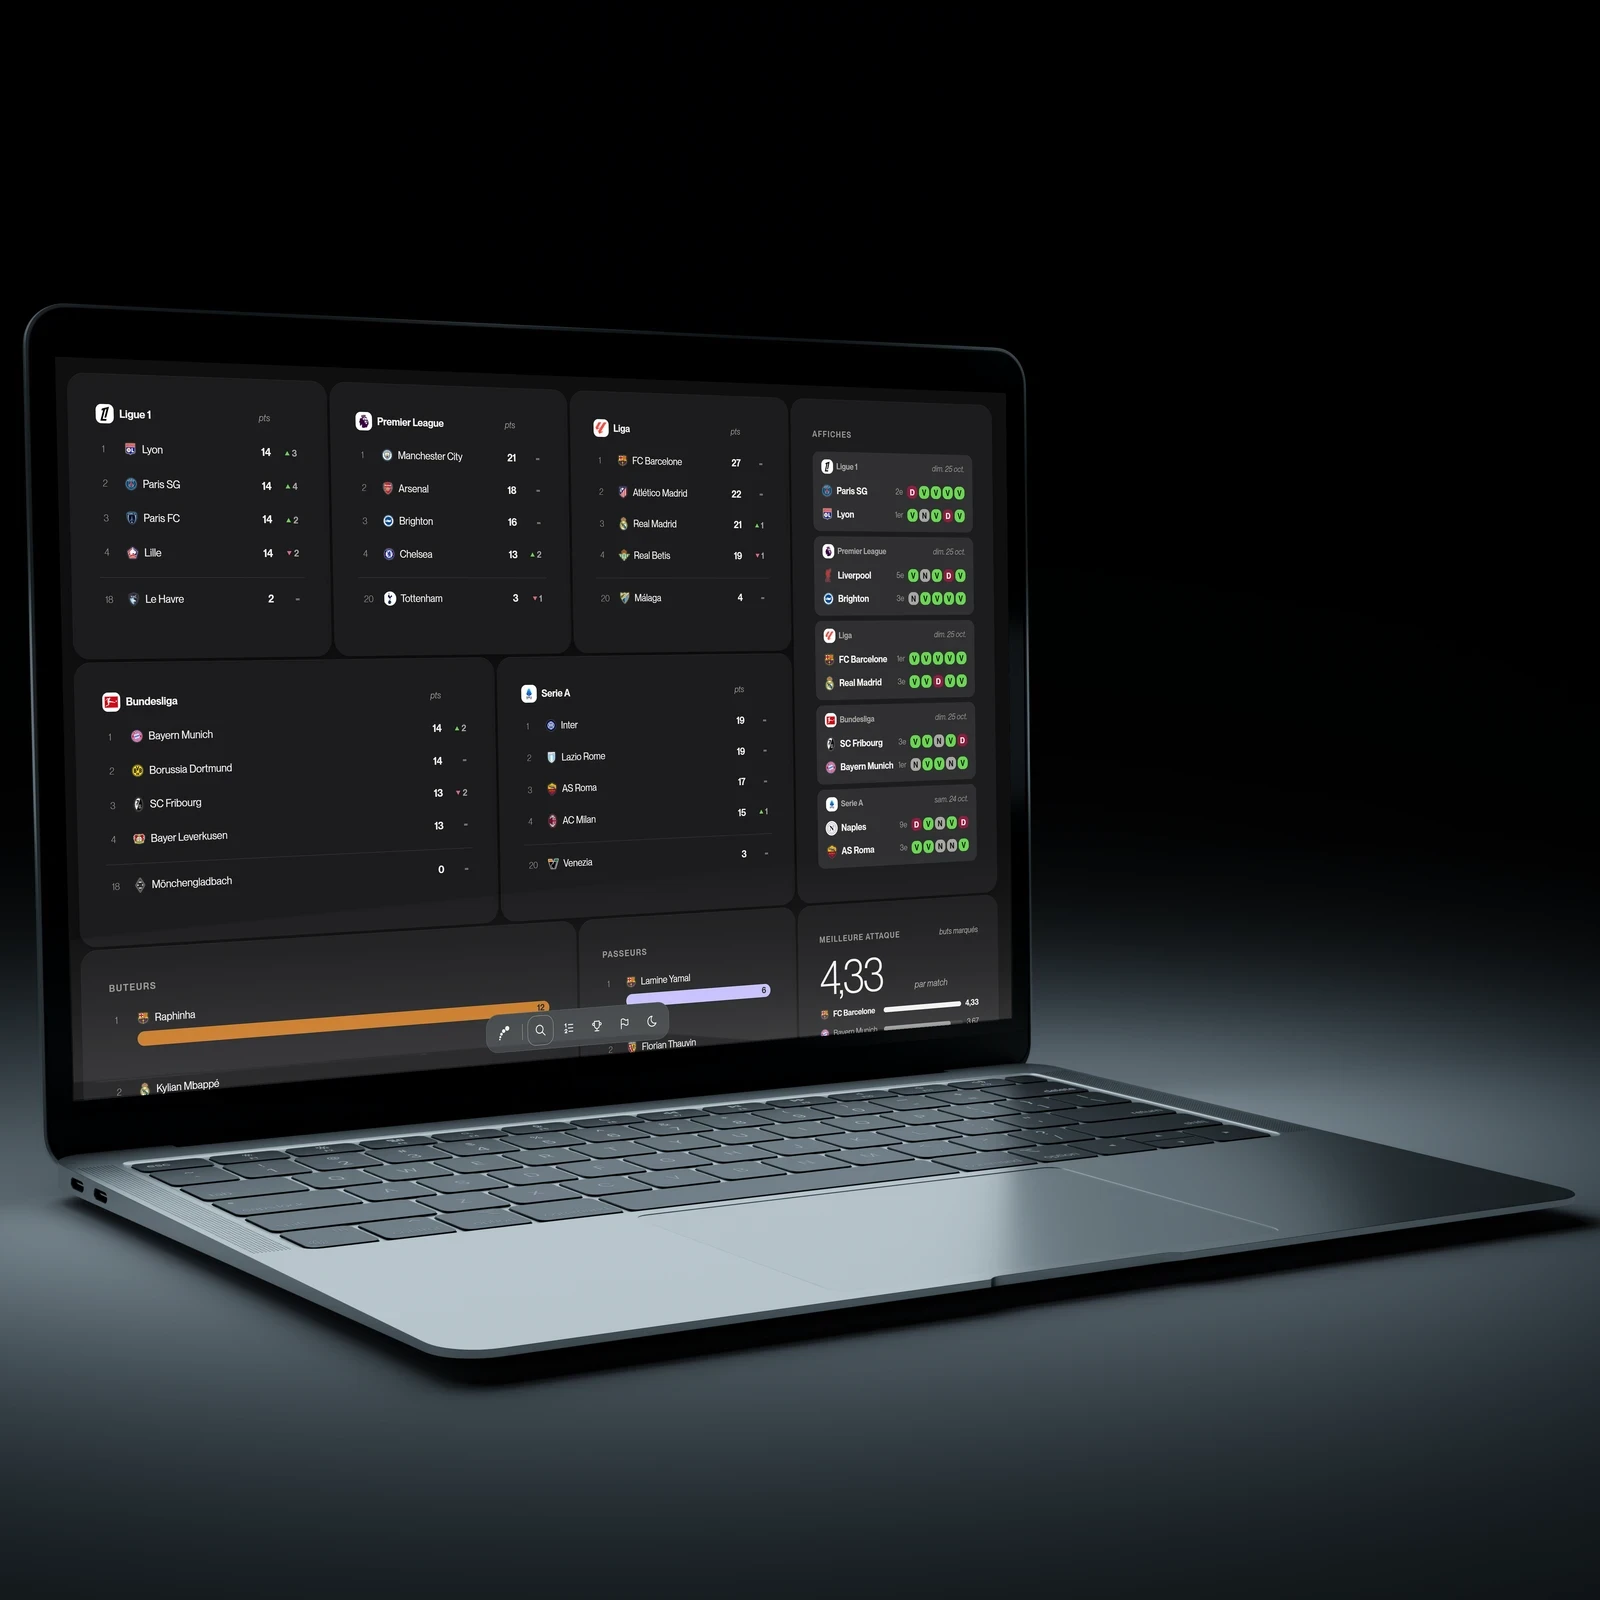
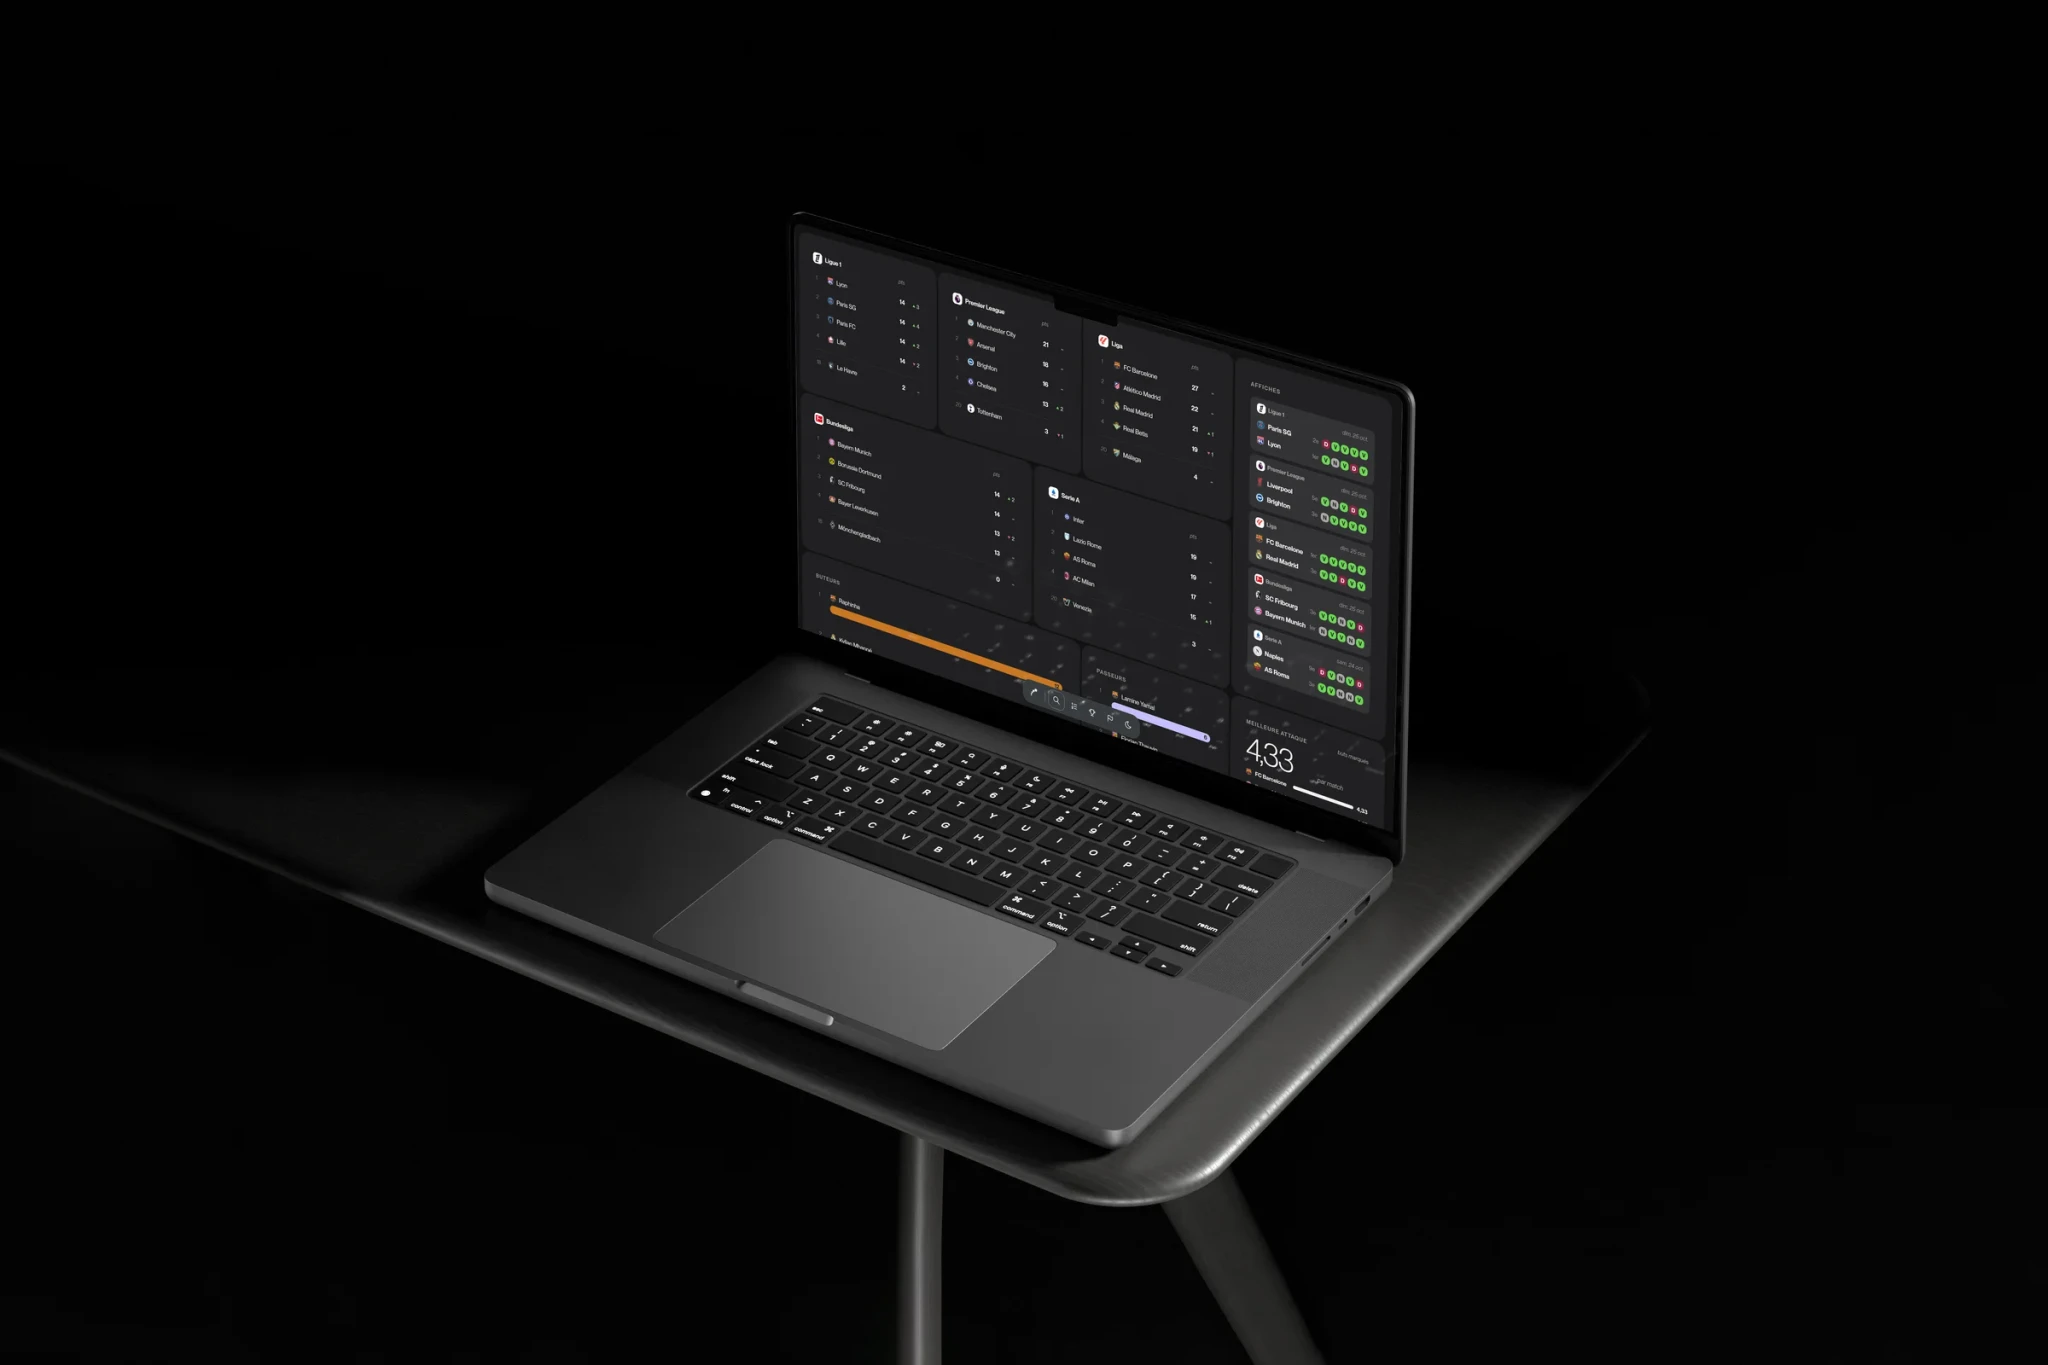
- A screen split into widgets, like an operating systemKept: blocks almost touching, each one a single ideaKept
- A particle fingerprint to sum up a playerRemoved: beautiful, but its values all hovered around the averageDropped
The name, in four steps
- “Ligue 1, en clair”The working name, when the site only covered Ligue 1
- “En clair”When the site opened up to the rest of Europe
- “Five”The five leagues, and five-a-side football
- “Saison”Common to football and basketball, so it could extend to the NBA
Design
Every visual choice was presented to me on a board of options before it was built.
A grammar of shapes, applied everywhere
From brief to site
One shape per type of numberOne stat, one shape
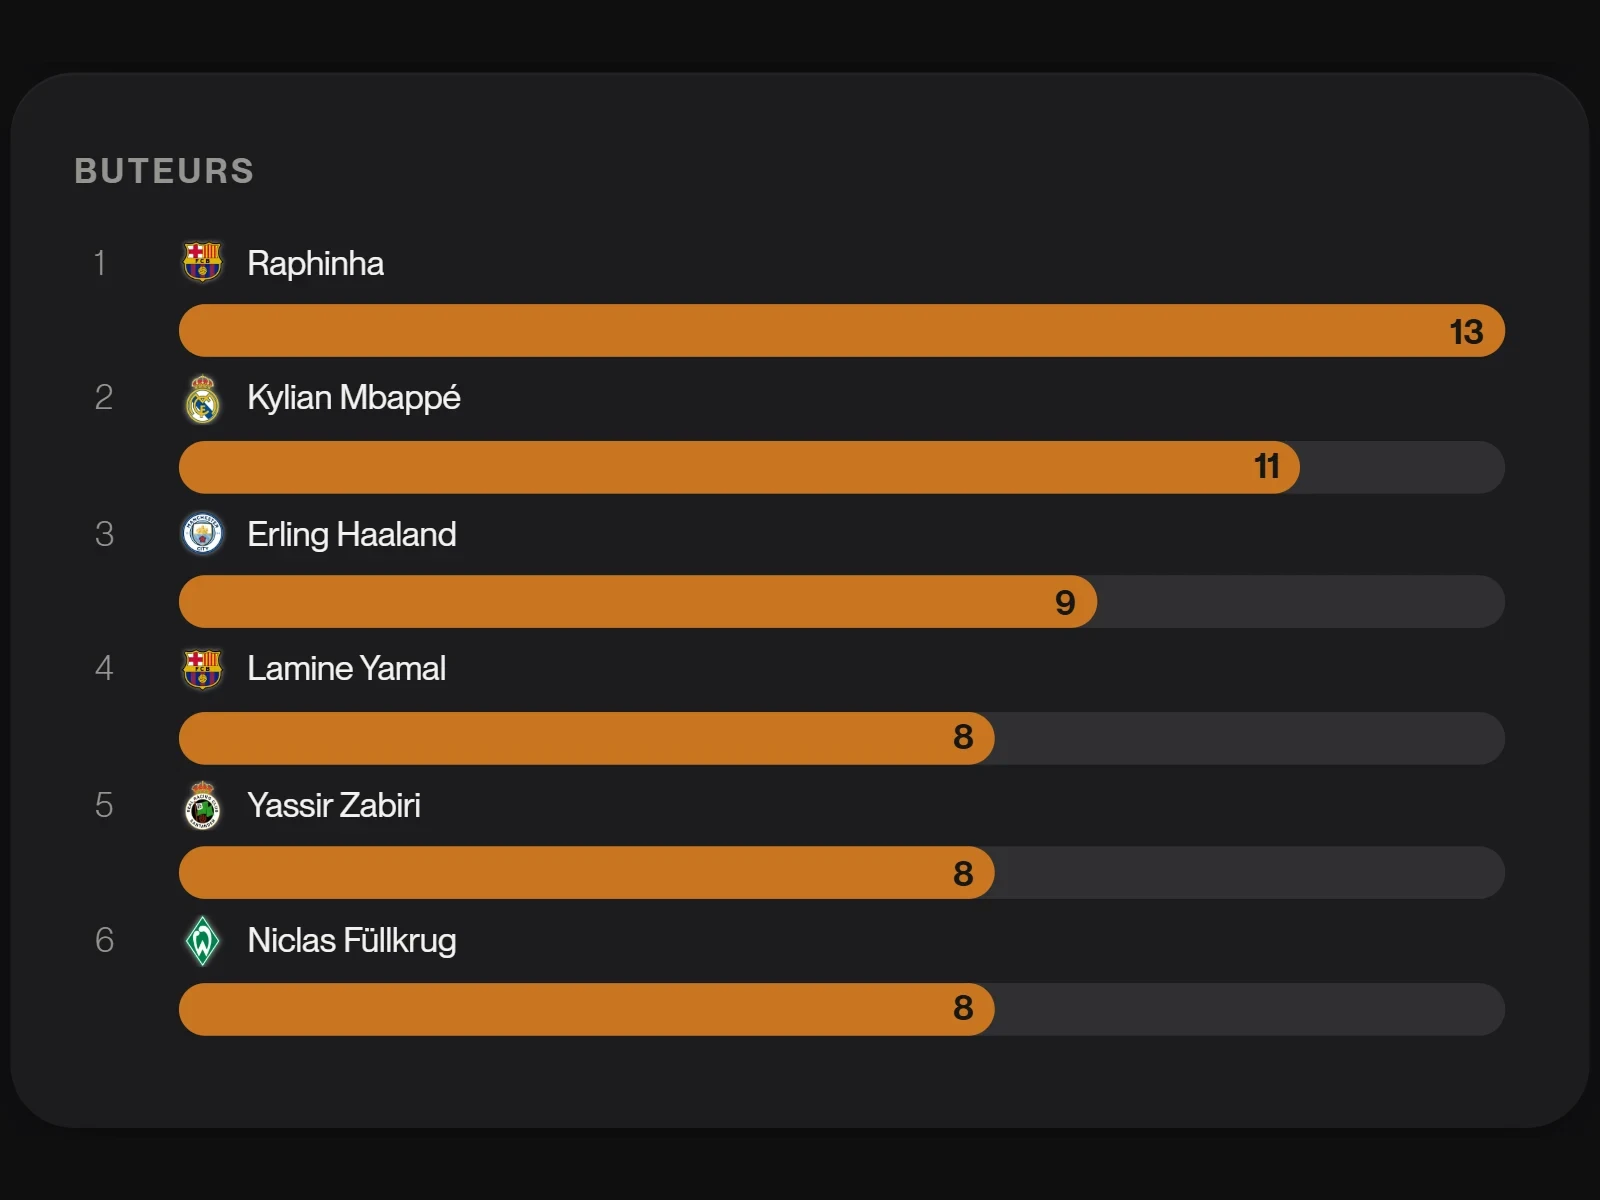 The thick bar with its numberGoals, assists, minutes: the bar under the name, the number at its end. The same everywhere.
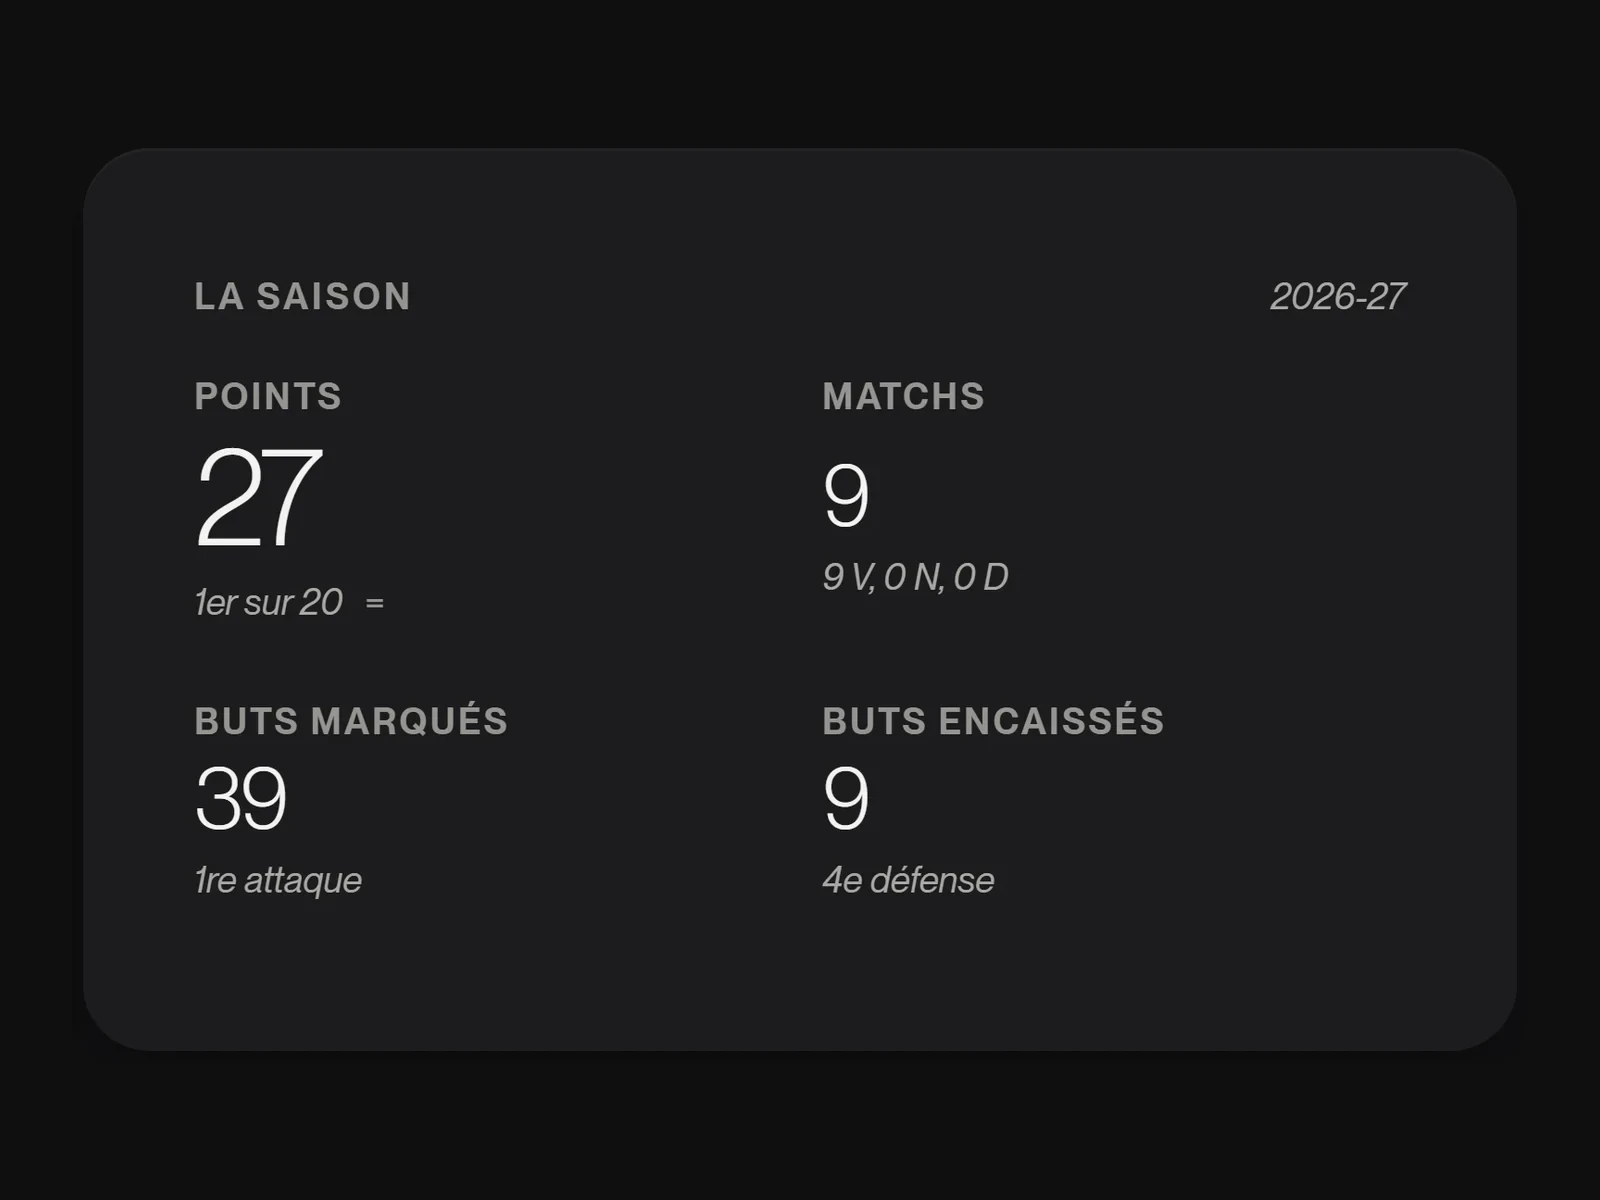 The number and its reference point“1st out of 18”, “2nd best attack”: never a number on its own.
Pages that look alikeOne piece of feedback applies to every page
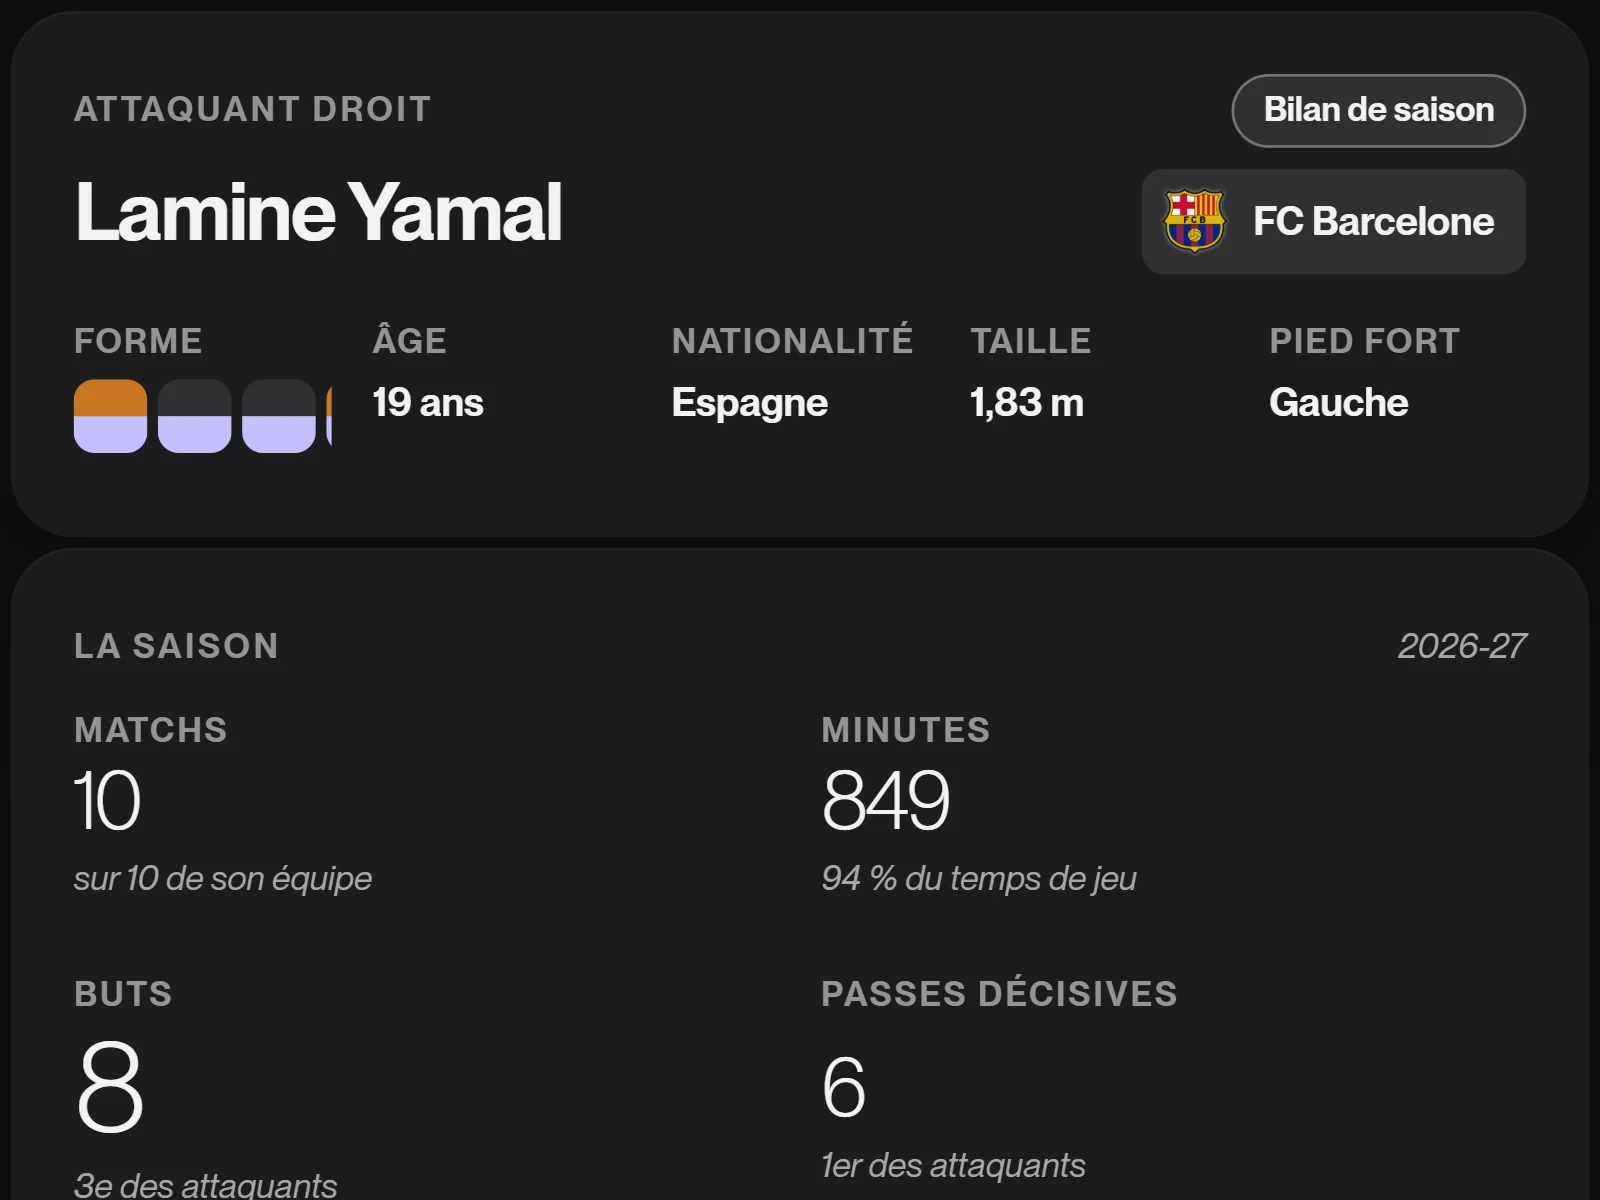 The essentials firstThe player page went from 35 blocks to 18 at most: the detail sits in a panel that slides in from the right.
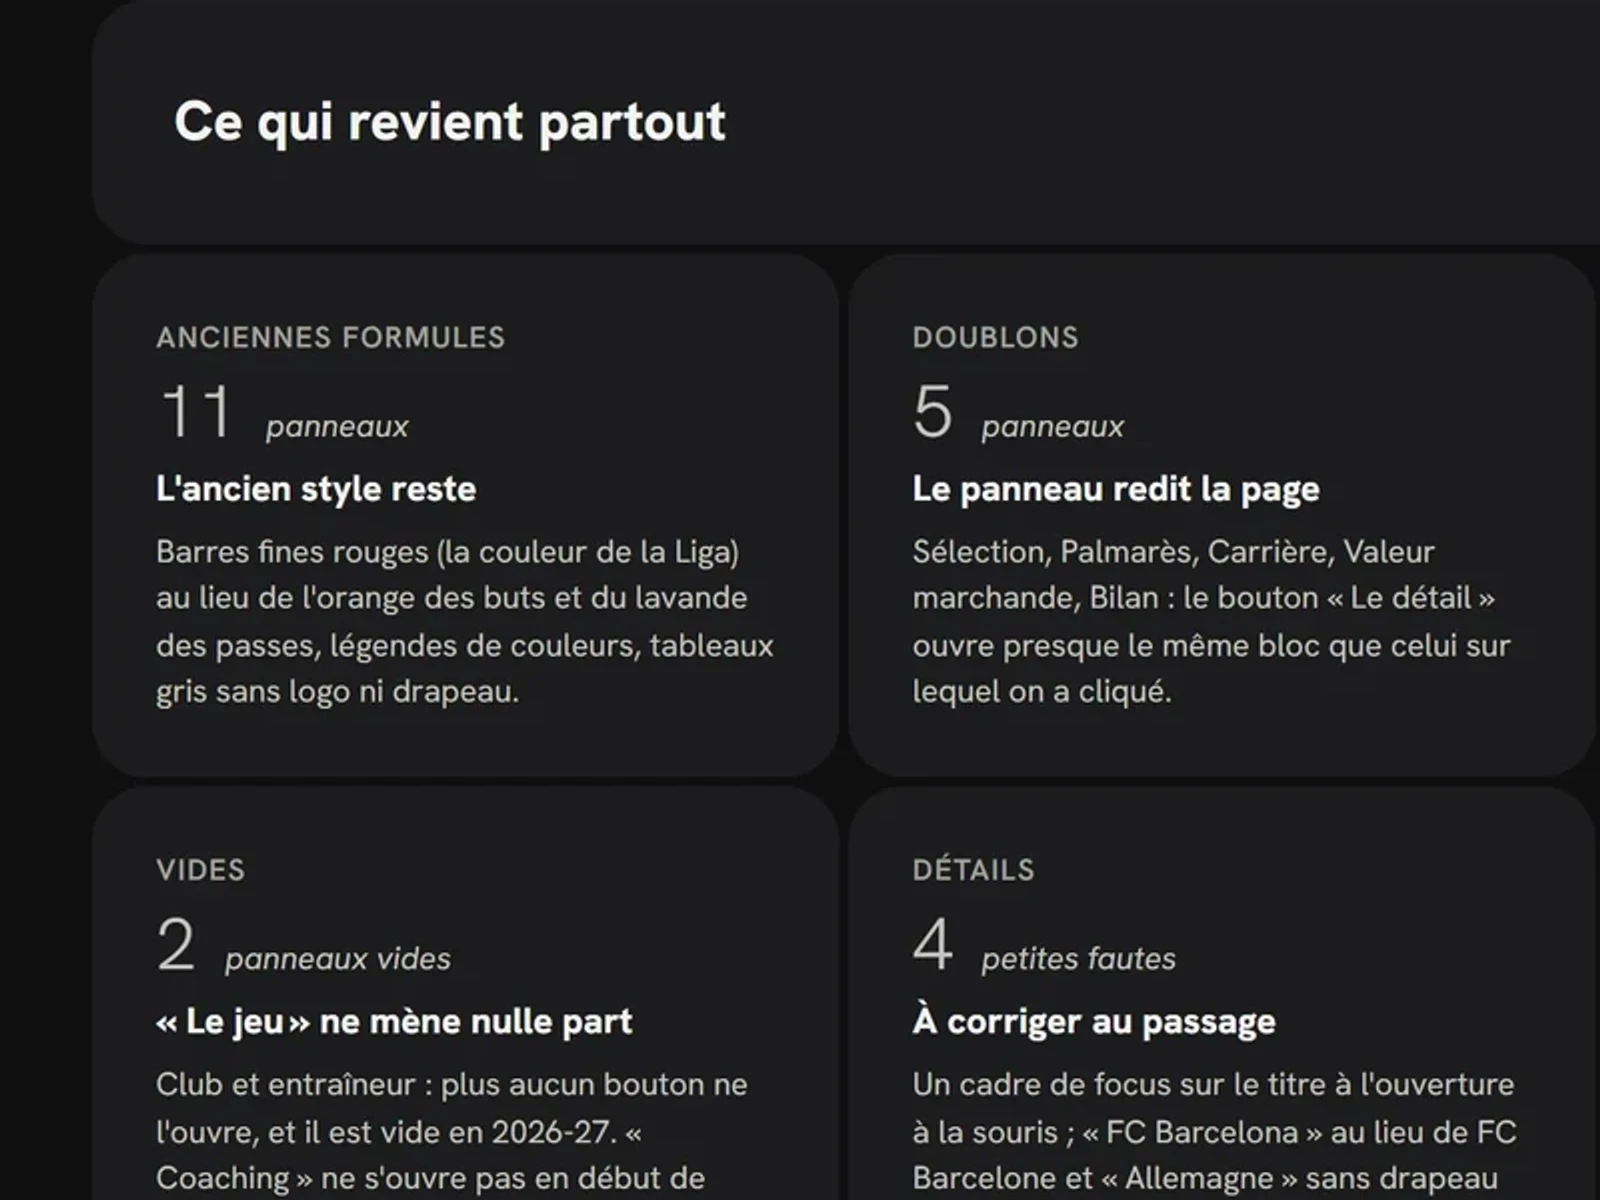 The boardsFor each page: a measured self-critique, two or three options, then my choice.
Readable for everyoneColour never says anything on its own
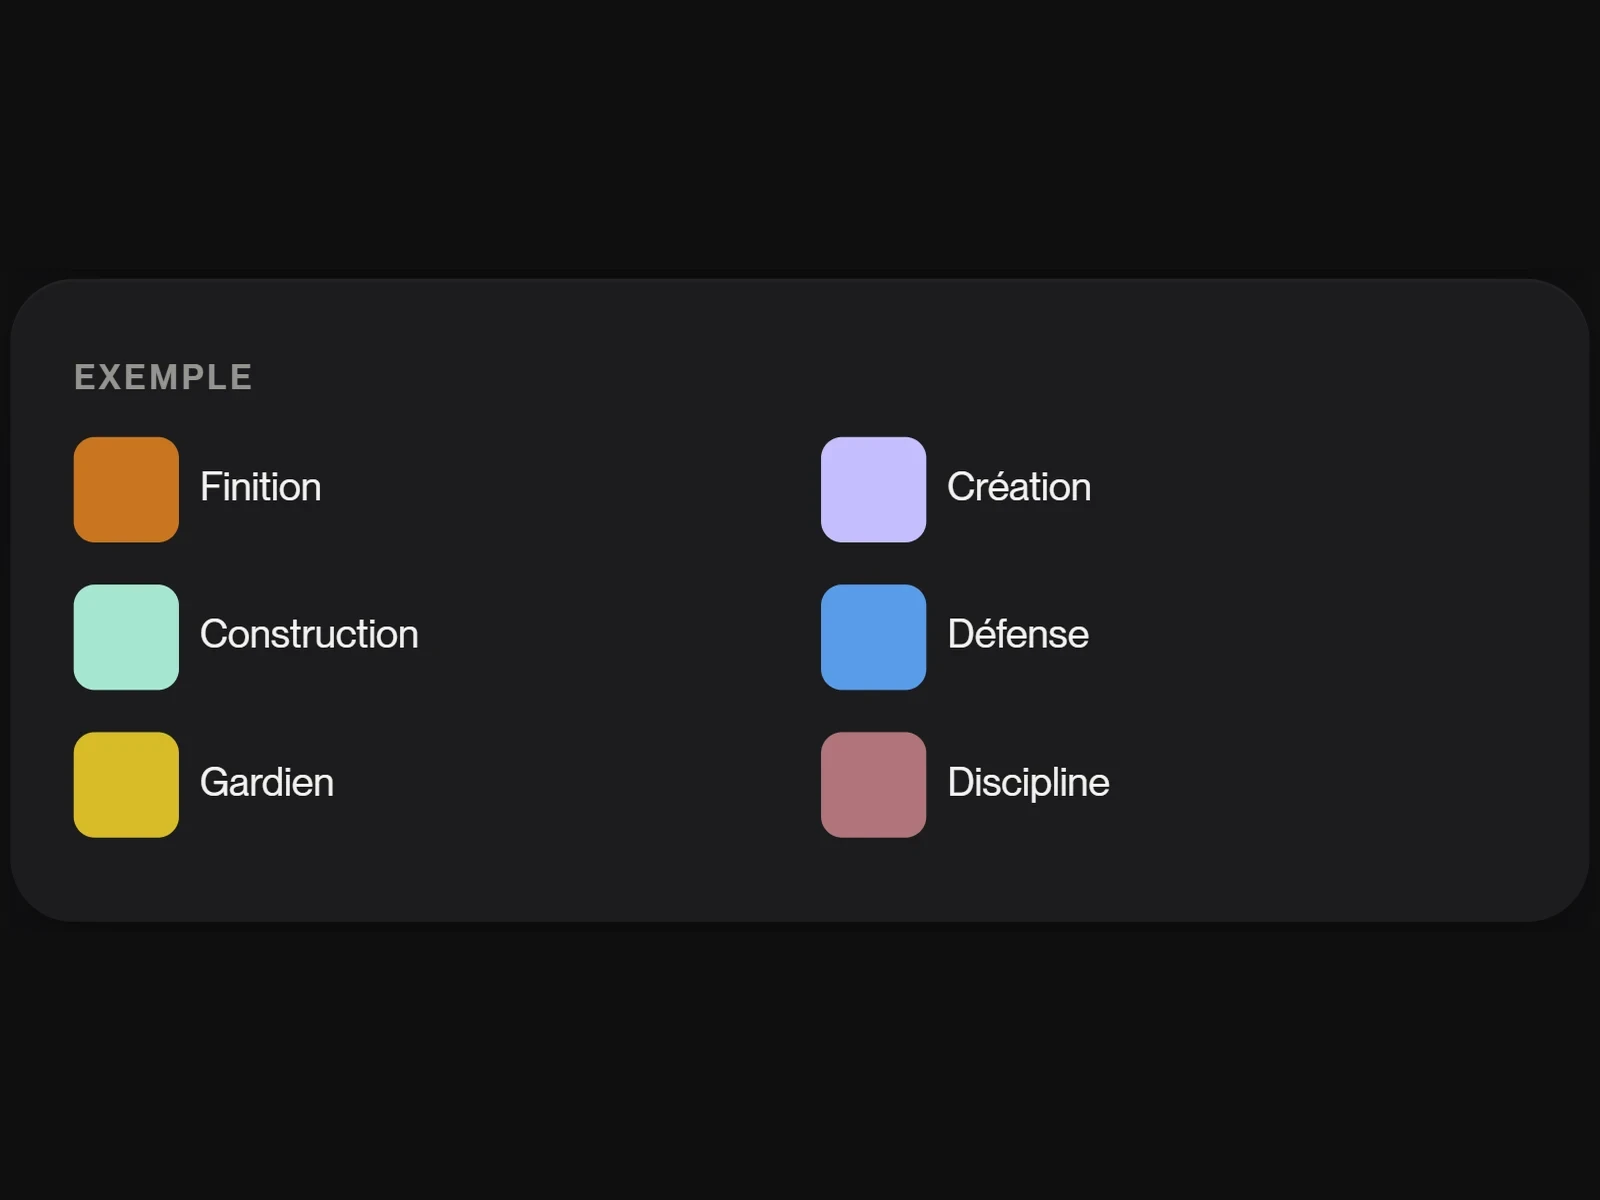 A tested paletteSix families of measures, with hues that stay distinct for eyes that confuse red and green.
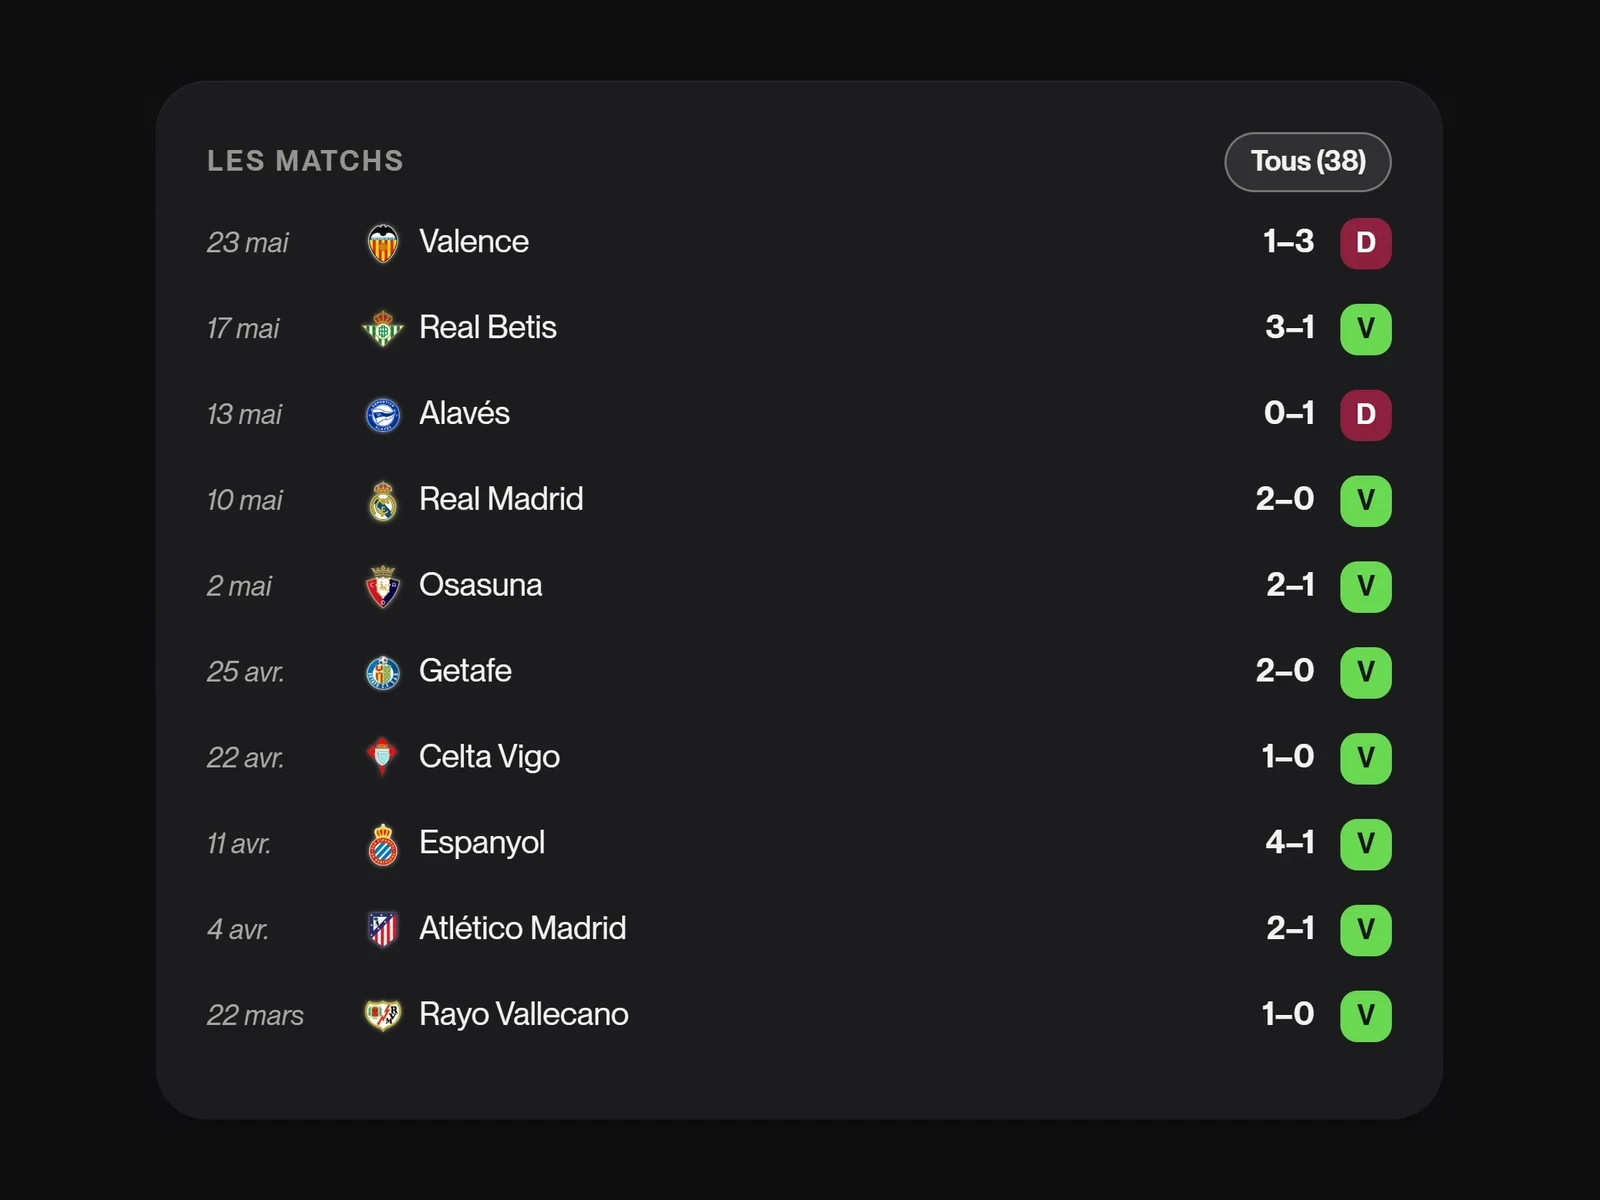 Win, draw, lossBright green, grey, burgundy, and always the letter written out: no result can be confused with the colours of goals and assists.
Basketball, kept apartTwo sports that never mix
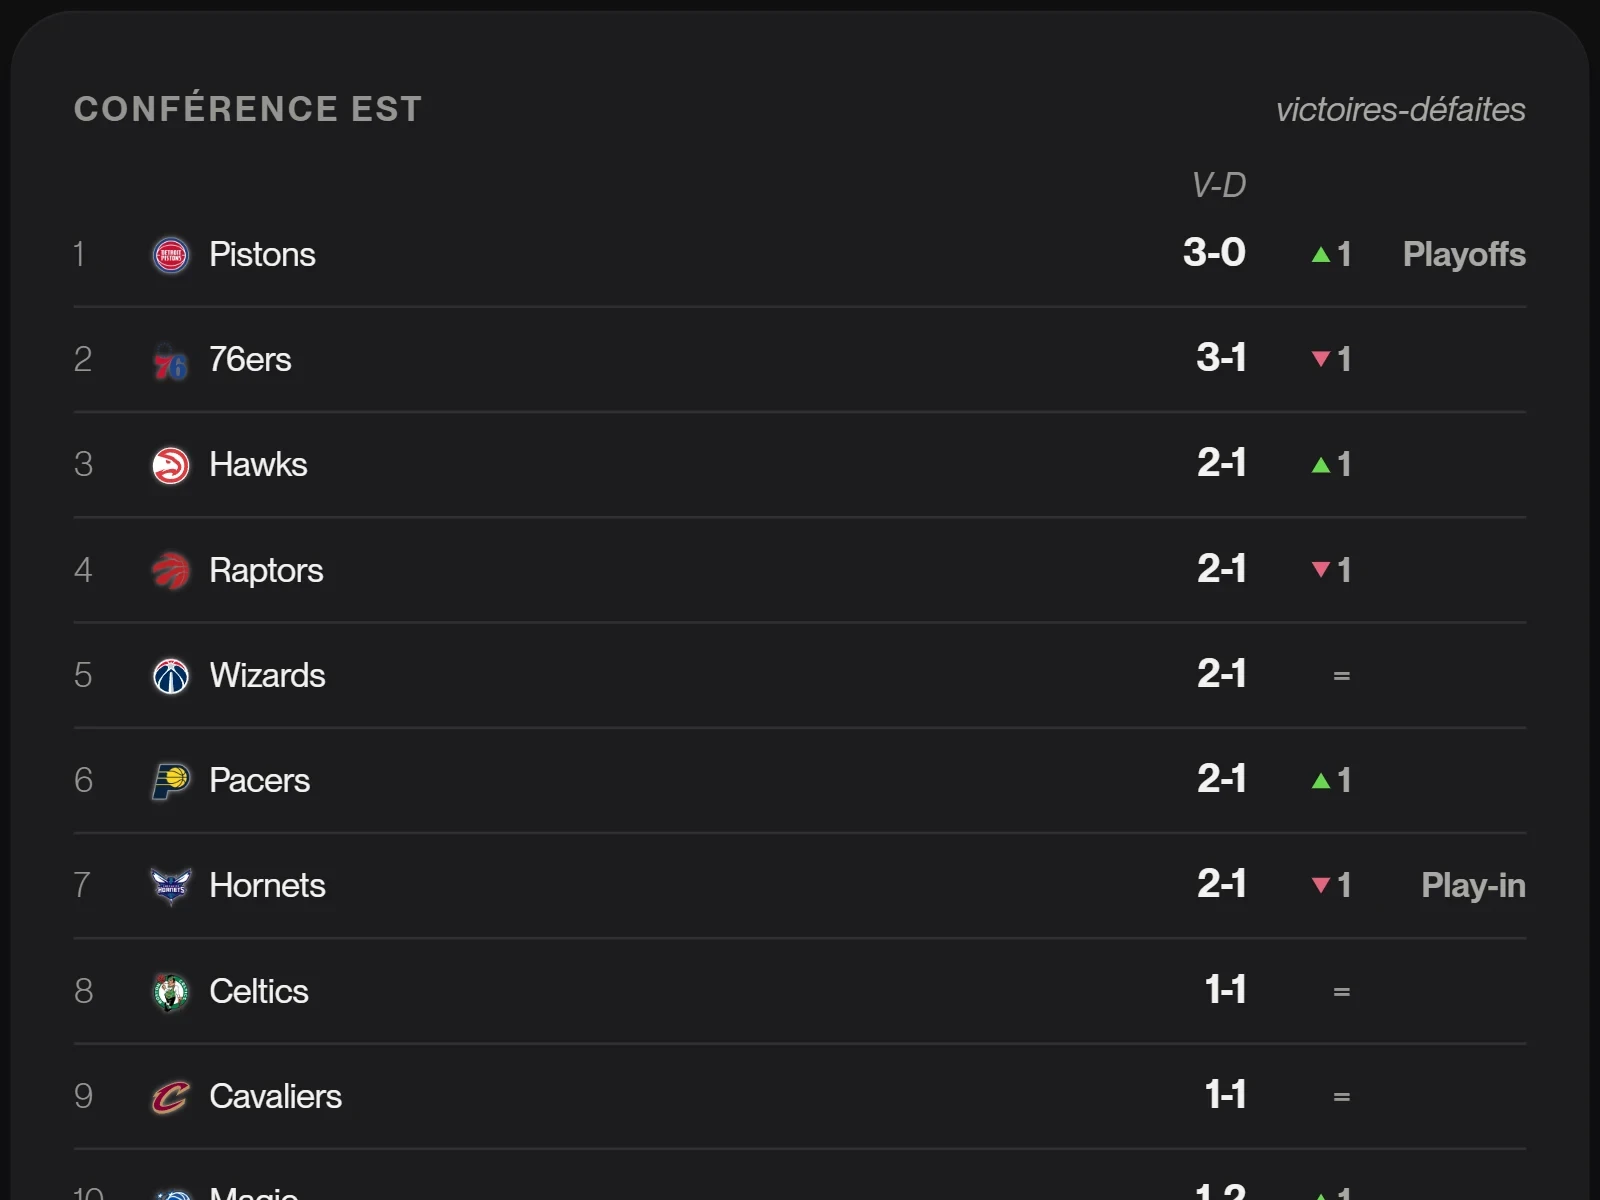 The NBA home pageThe Eastern and Western Conferences, upcoming games in Paris time, the top scorers and assist leaders: the same mosaic as football.
The project in numbers
- 9DaysFrom 12 to 20 October 2026
- 2 775Players tracked2025-26 season, across 96 clubs in the five major leagues
- 10CompetitionsFive leagues, the Coupe de France, three European cups and the NBA
- 0Player photosA name and their club's logo are enough
Tests
An automatic spacing check before every “it's done”: 4 px between blocks, nothing overflowing, no text under 13 px.
Checking every screen, by measurement
Saison has not yet been tested by other people. Every screen was checked for real, in light mode, in dark mode and on phone.
Checked with every change
- The spacing of every page, measured on screen by a script
- The contrast of text and outlines (WCAG AA)
- Colours in normal vision, deuteranopia and protanopia
- The keyboard: every action works without a mouse, Esc closes everything
- Phone, tablet and large screen
- An accessibility audit of twelve pages, in light and dark mode, on desktop and phone: every target is at least 24 px
Fixed while reviewing the data
- The missing finalsThe dataset stopped at the semi-finals: the finals were filled in from Wikipedia.
- Overlong names“Olympiakos Syndesmos Filathlon Peiraios” became Olympiakos, as did 118 other clubs.
- A coach listed twice“FC Barcelone” and “FC Barcelona” made two rows in the same career: now there is only one.
- A home page that was too heavyIt downloaded 2.3 MB: splitting the seasons into two parts and lighter logos brought it down to 1.5 MB.
To do
- A test with three football fans and one fantasy football player
- Current-season cup matches, which no free source provides yet
Retrospective
The hardest part was not adding numbers, but choosing which ones to show.
Leading a data product from start to finish
Doing it differently
I should have set the grammar before the pages.
I reviewed each page one by one, then applied each piece of feedback to the others. Setting the allowed shapes from the start (one stat, one shape) would have saved me from redoing the same blocks several times.
- A test with real fans, on phone, during a match
- Current-season cup matches
Credits
Designed and directed by Martial Deleplanque, developed with Claude Code. Data: Understat, transfermarkt-datasets (CC0 licence), Wikidata, Wikipedia (CC BY-SA); trophy photos: Wikimedia Commons. Typeface: PP Neue Montreal (Pangram Pangram). Club and competition logos belong to their owners: unofficial concept, not affiliated with the leagues or the clubs.